Private preview
One AI workspace for data, analysis, and slides
Acquisition cash bridge · Cap Studio
Meet Cappy, your AI analyst.
Cappy pulls data, runs analysis and builds the slides, on one canvas your whole team can see and check.
Stop the slop.
The usual way: a pile of disconnected files
Build our Q3 revenue review from Salesforce.
Here's your model.Xq3_revenue.xlsx
Now turn it into a deck.
Done, see attached.Pq3_review.pptx
Add churn by segment to slide 4.
Xq3_revenue_v2.xlsxPq3_review_v2.pptx
The fonts on slide 3 are wrong again.
Fixed!Pq3_review_v3_FINAL (2).pptx
Cap Studio: one project that grows
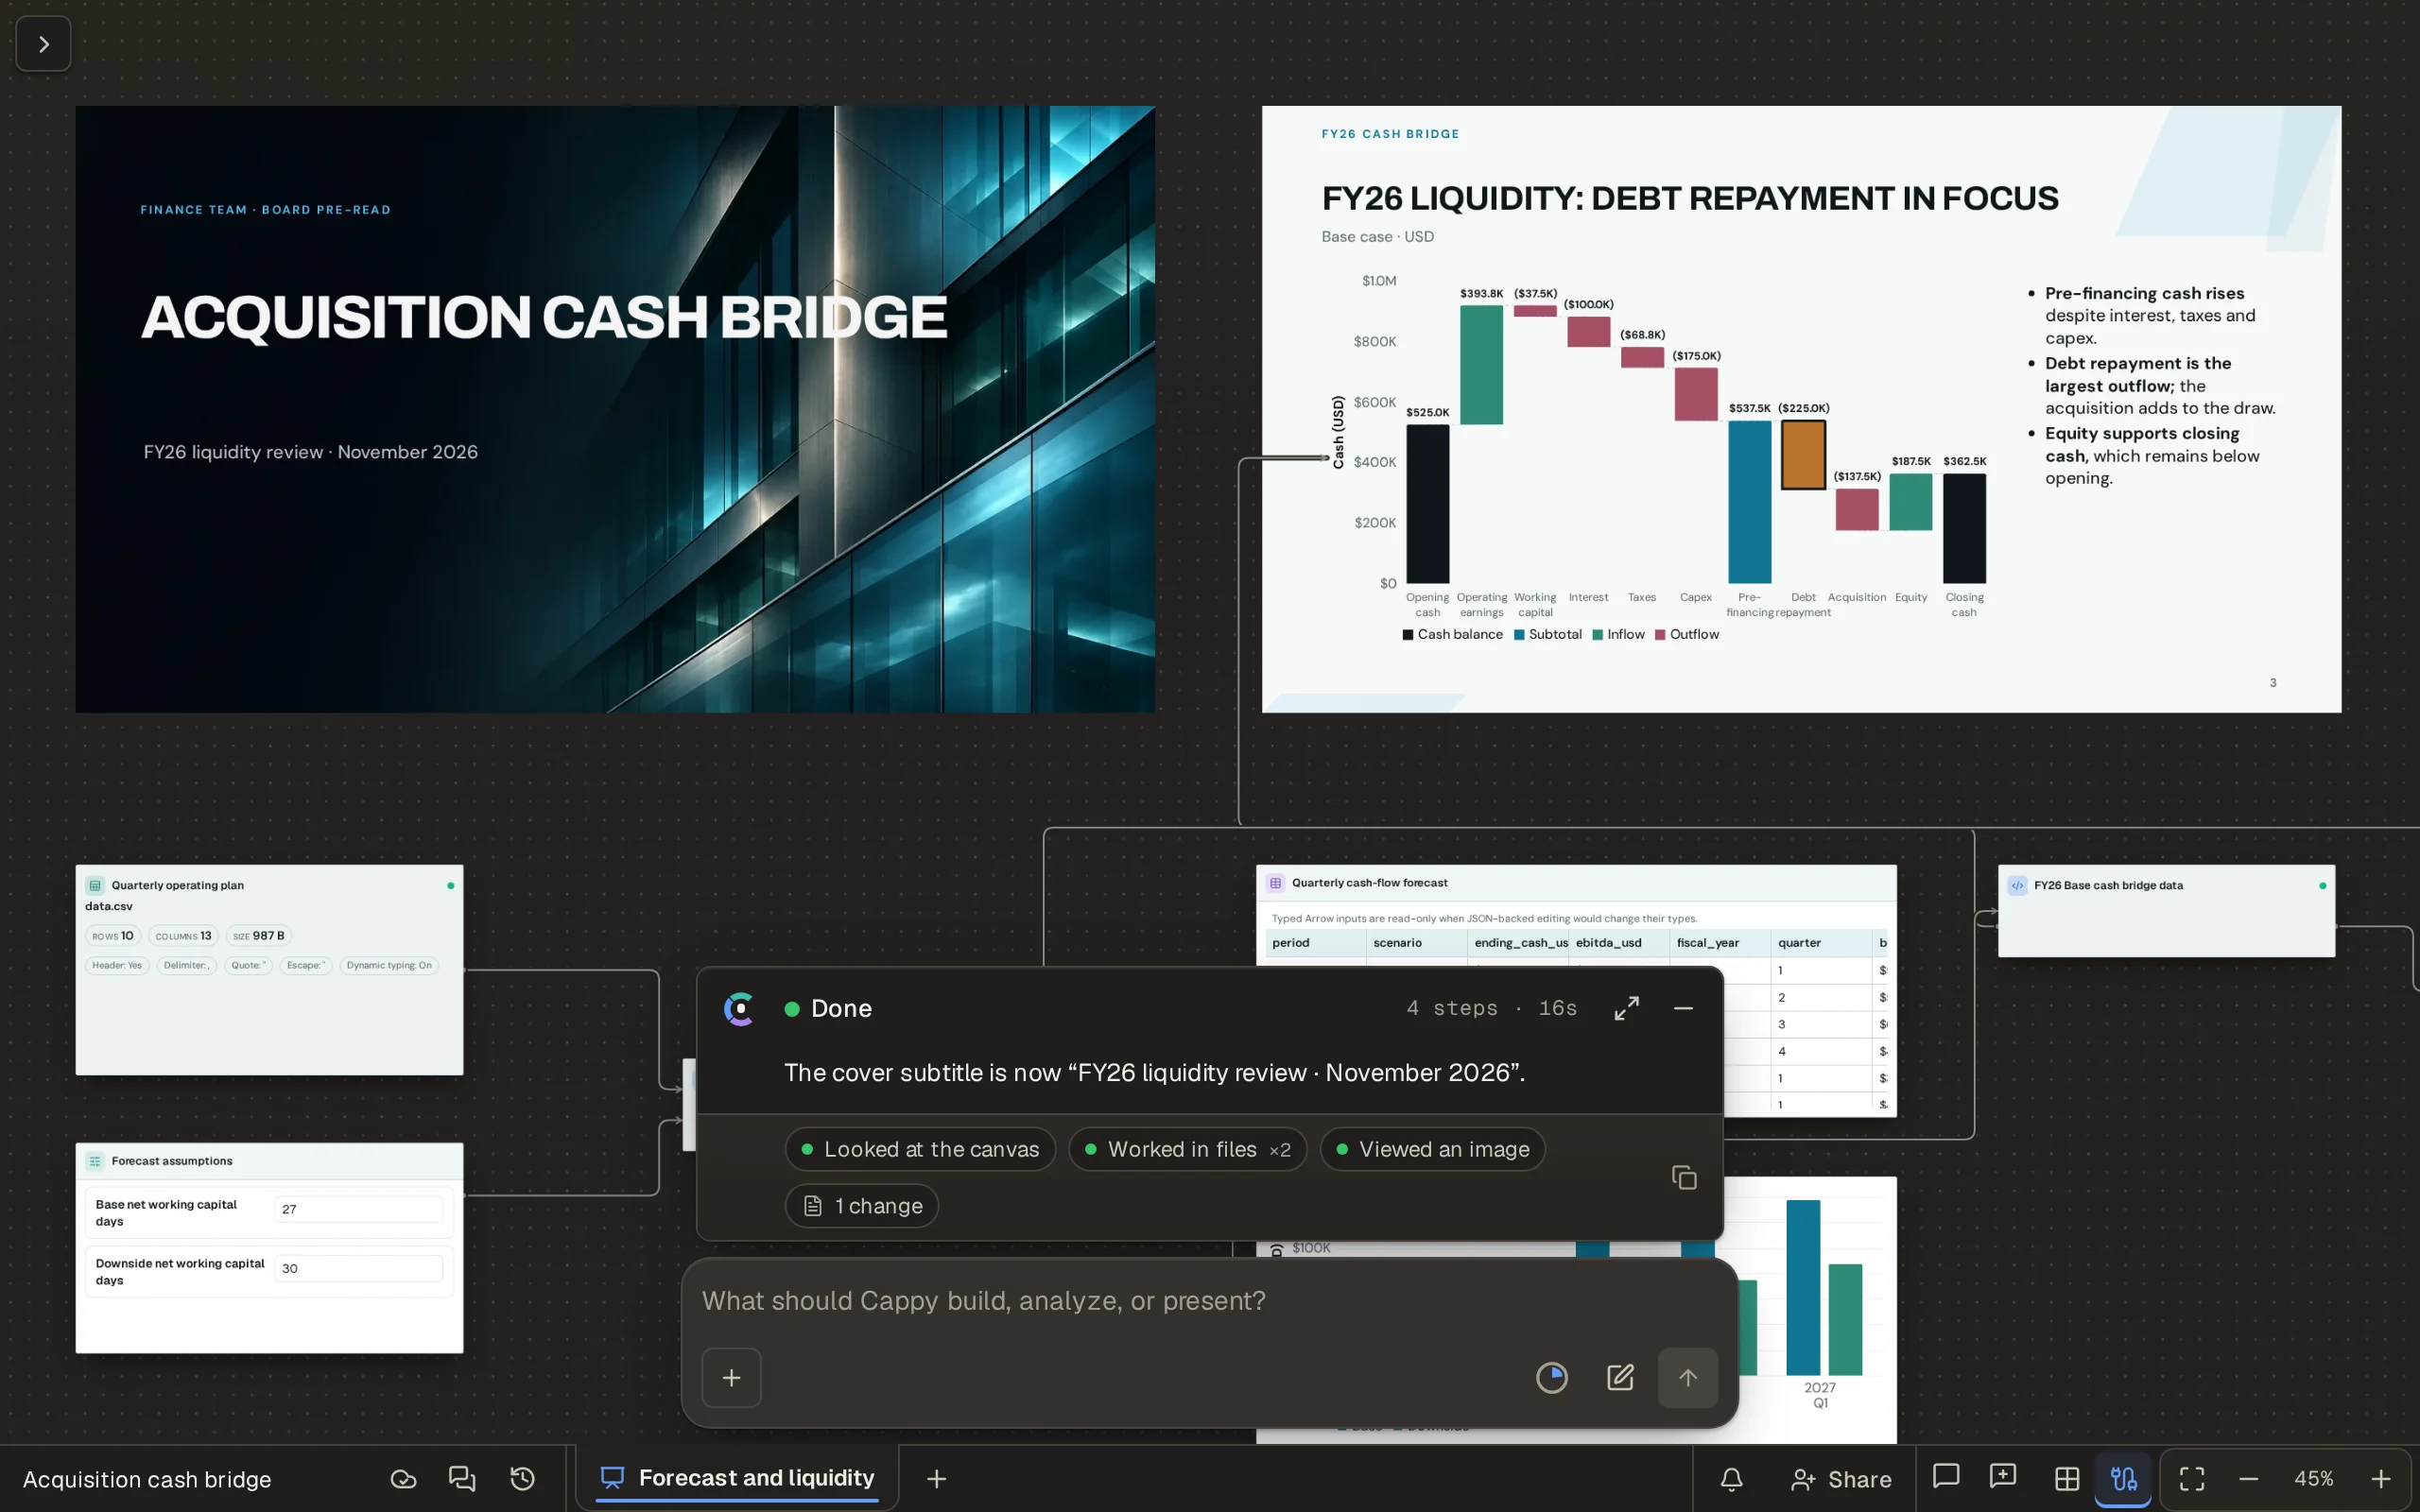
Add churn by segment to slide 4. One canvas, start to finish.
Bring data in from anywhere
DatabasesSQLSnowflakeBigQueryRSRedshiftClickHouseFMicrosoft Fabric Business appsSalesforceHubSpotNNetSuiteQuickBooksXeroStripeGoogle DriveOneDrive Files, storage and the webXExcelPPowerPointPDFPDFsCSVCSVS3S3-compatible storage{ }REST APIsWeb research Powerful analytics in a flash
S3S3
AWS billing export38M line itemsPlanned projects214 open epics Cappy · editingModel
Cloud cost forecastAssigns spend to teams and projectsForecasts 12 months, including planned work
Table
Forecast by teamInfra$10.6M4% underData$7.4M6% overSearch$3.7M4% under
On your team's theme
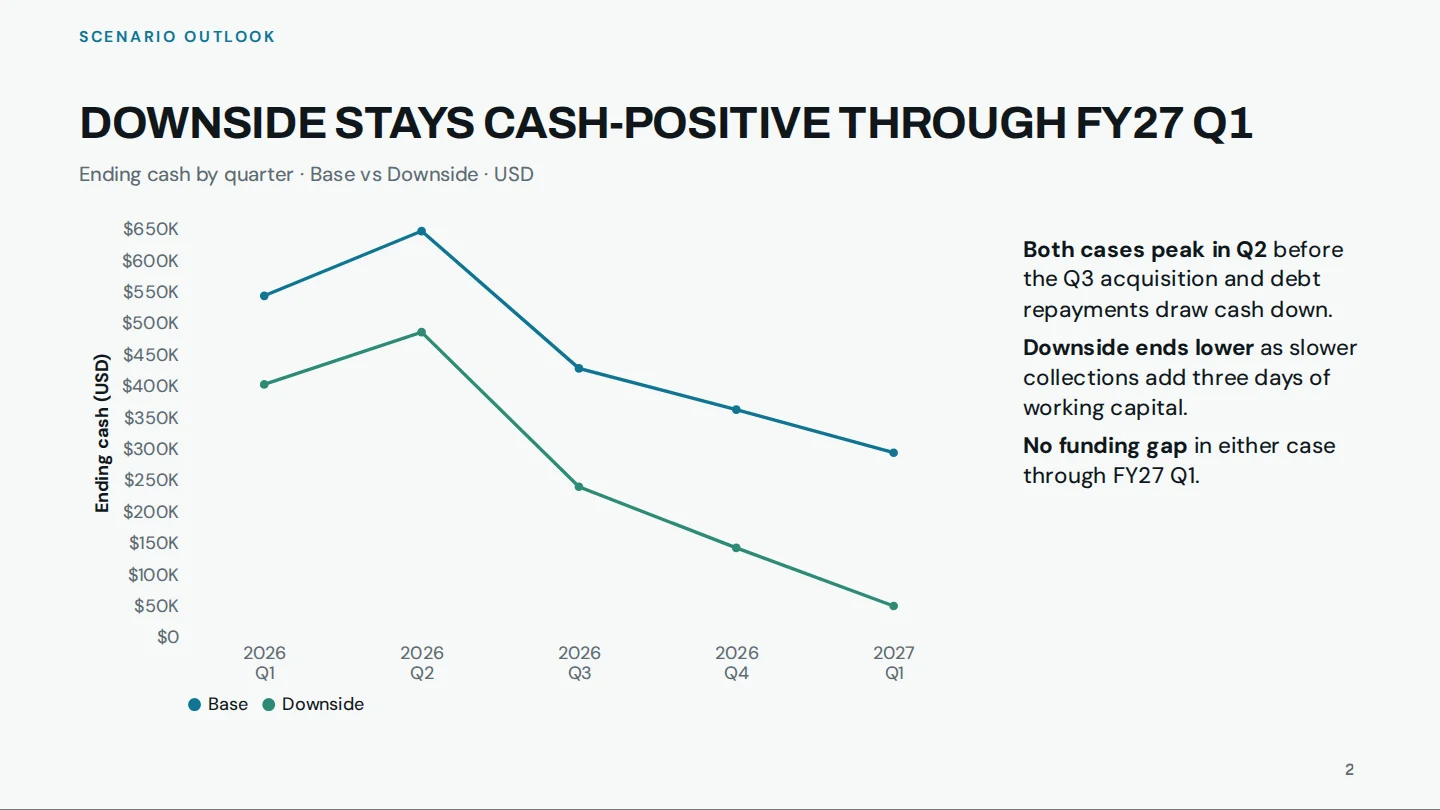 Chart linked to the cash-flow forecast
2 / 3PresentShare linkPDF Answers from everything you've connected
Why did gross margin dip in Q3?
Searching 22 sources and models…Done · 22 sources and models
Freight costs rose 18% after the July carrier change, and two enterprise renewals slipped to Q4. Together they explain 2.1 of the 2.4 points.
Invoices · 4.2M rowsMargin bridgePipeline
Every source, every calculation, and every slide in one place, connected the way the work flows.
Every deck is a live dashboard.
Slides stay connected to your data. A single click refreshes the weekly review, board pack, and budget forecast.
Cloud spend · Cap StudioLive
CLOUD SPEND · Wk 45CLOUD SPEND · Wk 46
Back to budget after the week 43 spikeBack under budget after the week 43 spike
Spend this week
$418K$404K
$2K under budget$16K under budget
Quarter-end forecast
$5.41M
$50K under budget
Untagged spend
6%4%
Down 1 pt this weekDown 2 pts this week
$480K$420K$360K
Wk 40Wk 41Wk 42Wk 43Wk 44Wk 45Wk 46
ActualBudget
- Weekly KPI reviews
- Board packs
- Investor updates
- Pipeline reviews
- Cloud budgets
Work product that's right the first time.
Client-ready on the first pass.
Cap StudioProject Atlas · Merger analysis
Accretive from year one at a 30% premium
- Offer premium
- 30%
- Consideration
- 60% stock / 40% cash
- Run-rate synergies
- $1.2B
Accretion / Dilution Analysis
• Deal is accretive• Synergies of $1.2B• EPS impact shown in chart• Premium of 30%
A merger model from six filings.
Up to3×faster
PDF6 filings read
0:38
Model built
1:34
Deck ready
2:21
General AI agent writing Excel and PowerPoint files7:00
Decks Cappy built from the data up.
Office productivity for the AI age
Next-level analysisReal data science horsepower
Simulations, regressions and forecasts across millions of rows, answered in seconds. Analysis that once took a quant team is now one question away.
Run 10,000 scenarios on next year's plan. How likely are we to hit $50M?
73%chance of reaching the $50M plan
$38MFY27 revenue across 10,000 scenarios$62M
10,000scenarios
38sstart to answer
1question asked
ResearchResearch on demand
Cappy finds data in reports, on the web, and in your systems, and saves it to the project.
Researching our top competitors
Competitor pricing pages✓ PDF2026 industry report✓
Saved to the project · 3 tables
ThemesYour brand on every slide
Set fonts, colors and layouts once. Every deck follows.
Q3 REVIEWBookings beat plan by 12%
Q3 REVIEWBookings beat plan by 12%
Q3 REVIEWBookings beat plan by 12%
ImagesImages on demand
Describe the picture you want. Cappy makes it and fits it to the slide.
BOARD UPDATEExpanding into the SouthwestNovember 2026
A desert at dawn✓ Added to the cover Live collaboration with
Cappy and your team.
Rows4.2MColumns18Refreshed today
Updated by Cappy · View change
Revenue growth6.0%4.0%
EBITDA margin22.5%
Fits revenue by segmentProjects 12 months ahead
Slide 4FY27 revenue: base and 4% cases Updating the growth assumption…
At 4% growth FY27 revenue is $46.9M, and slide 4 now shows both cases.
Looked at the canvasWorked in files ×23 changes
What should Cappy build, analyze, or present?Show this with 4% growth instead.
Q4 board updateBoard packAYShare−75%+ Up and running in minutes.
Drop in the models, decks, documents and brand assets you already have. Cappy rebuilds them as live Cap Studio projects.
1Drop in what you haveXQ3 operating model.xlsx
PBoard deck, October.pptx
PDFVendor contracts.pdf
CSVCustomers.csv
IMGProduct photos.zip
AaBrand kit.zip
Files, images and brand assets 2Work in a live projectSourceContract terms38 contracts read
TableRevenue buildfrom the Q3 model
ModelOperating modelrebuilt as a live model
SlidesBoard deckready to present
Built for sensitive work.
Easy to check, hard to get wrong
Every figure traces back to its source and the step that computed it. Nothing is copied by hand, so no stale number slips through.
You decide who sees what
Easily control who has access to your projects.
Every change on the record
Each edit, yours or Cappy's, is saved and attributed, and can be reviewed or undone.
- Encrypted in transit and at rest
- Single sign-on (SSO)
HistoryQ4 board update
Cappy set growth to 4.0% in Assumptions9:17 AAssociate commented on Valuation9:19
YYou edited the board slide title9:24
Cappy refreshed invoices with November actuals9:31